The following figures show the demand and supply of labor in two different types of labor market. Figure 15.5 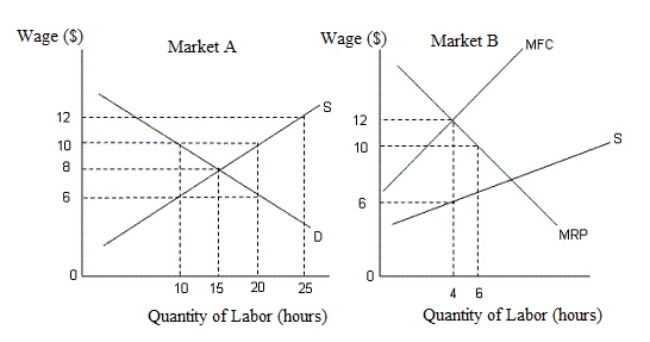 In the figures,
D: Demand curve for labor
S: Supply curve of labor
MRP: Marginal revenue product
MFC: Marginal factor cost
-Refer to Figure 15.5.If a minimum wage of $10 is set by the government,then in market A:
A) a shortage of 20 labor hours is created.
B) the quantity demanded for labor rises to 20 labor hours.
C) a shortage of 15 labor hours is created.
D) a surplus of 20 labor hours is created.
E) a surplus of 10 labor hours is created.
Correct Answer:
Verified
Q46: The figure given below shows the income-leisure
Q47: The following figures show the demand and
Q48: The following figures show the demand and
Q49: The figure given below shows the income-leisure
Q50: The figure given below shows the income-leisure
Q51: The figure given below shows the income-leisure
Q53: The burden of a tax is mainly
Q55: Which of the following is true of
Q56: The figure given below shows the demand
Q60: The figure given below shows the demand
Unlock this Answer For Free Now!
View this answer and more for free by performing one of the following actions

Scan the QR code to install the App and get 2 free unlocks

Unlock quizzes for free by uploading documents