The figure given below shows the revenue and cost curves of a perfectly competitive firm. Figure 9.2 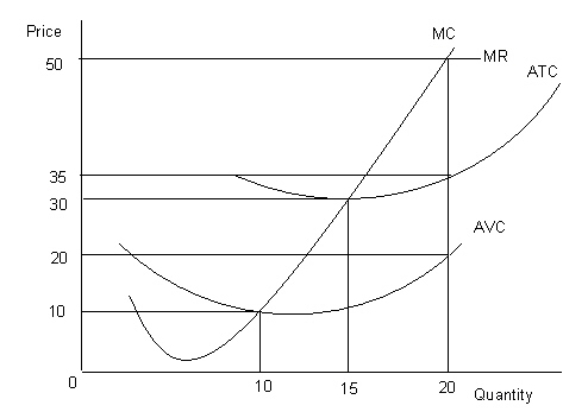
MC: Marginal cost curve
MR: Marginal revenue curve
ATC: Average-total-cost curve
AVC: Average-variable-cost curve
-Refer to Figure 9.2.The firm will suspend production if the price falls below:
A) $30.
B) $50.
C) $10.
D) $20.
E) $35.
Correct Answer:
Verified
Q45: The figure given below shows the revenue
Q48: The figure given below shows the revenue
Q49: The figure given below shows the revenue
Q50: If the marginal cost exceeds the marginal
Q50: The figure given below shows the revenue
Q52: The figure given below shows the revenue
Q53: The figure given below shows the revenue
Q54: The figure given below shows the revenue
Q56: The figure given below shows the revenue
Q57: The figure given below shows the revenue
Unlock this Answer For Free Now!
View this answer and more for free by performing one of the following actions

Scan the QR code to install the App and get 2 free unlocks

Unlock quizzes for free by uploading documents