The figure given below shows the revenue and the cost curves of a perfectly competitive firm. Figure 9.3 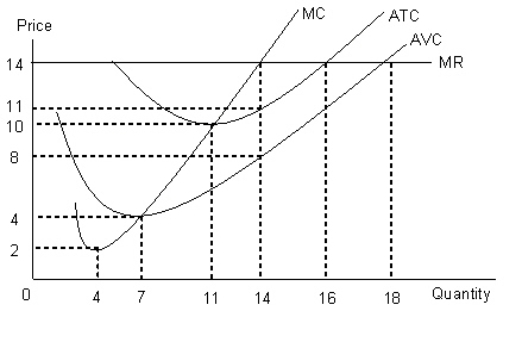
- In Figure 9.3,the profit maximizing output of the firm is _____ units.
A) 4
B) 16
C) 11
D) 7
E) 14
Correct Answer:
Verified
Q44: The figure given below shows the revenue
Q45: The figure given below shows the revenue
Q45: The figure given below shows the revenue
Q48: The figure given below shows the revenue
Q50: The figure given below shows the revenue
Q50: If the marginal cost exceeds the marginal
Q51: The figure given below shows the revenue
Q52: The figure given below shows the revenue
Q53: The figure given below shows the revenue
Q54: The figure given below shows the revenue
Unlock this Answer For Free Now!
View this answer and more for free by performing one of the following actions

Scan the QR code to install the App and get 2 free unlocks

Unlock quizzes for free by uploading documents