Figure 17-2. On the graph, MS represents the money supply and MD represents money demand. The usual quantities are measured along the axes. 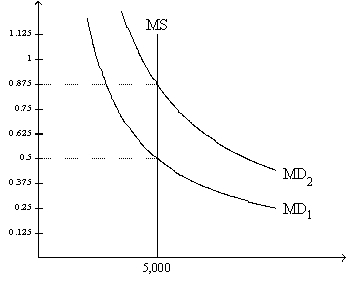
-Refer to Figure 17-2. At the end of 2009 the relevant money-demand curve was the one labeled MD2. At the end of 2010 the relevant money-demand curve was the one labeled MD1. Assuming the economy is always in equilibrium, what was the economy's approximate inflation rate for 2010?
A) -43 percent
B) -57 percent
C) 57 percent
D) 75 percent
Correct Answer:
Verified
Q52: The economy of Mainland uses gold as
Q73: When the money market is drawn with
Q81: Figure 17-3. On the graph, MS represents
Q82: Figure 17-3. On the graph, MS represents
Q83: Figure 17-3. On the graph, MS represents
Q85: Figure 17-3. On the graph, MS represents
Q86: Figure 17-1 Q87: Figure 17-2. On the graph, MS represents Q88: Figure 17-2. On the graph, MS represents Q89: Figure 17-1 ![]()
![]()
Unlock this Answer For Free Now!
View this answer and more for free by performing one of the following actions

Scan the QR code to install the App and get 2 free unlocks

Unlock quizzes for free by uploading documents