Figure 17-3. On the graph, MS represents the money supply and MD represents money demand. The usual quantities are measured along the axes. 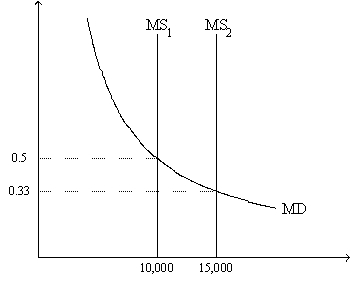
-Refer to Figure 17-3. Suppose the relevant money-supply curve is the one labeled MS2; also suppose the economy's real GDP is 45,000 for the year. If the money market is in equilibrium, then the velocity of money is approximately
A) 4.5
B) 6.0
C) 9.0
D) 12.0
Correct Answer:
Verified
Q48: In the fourteenth century,the Western African Emperor
Q52: The economy of Mainland uses gold as
Q73: When the money market is drawn with
Q75: The price level rises if either
A)money demand
Q81: Figure 17-3. On the graph, MS represents
Q83: Figure 17-3. On the graph, MS represents
Q84: Figure 17-2. On the graph, MS represents
Q85: Figure 17-3. On the graph, MS represents
Q86: Figure 17-1 Q87: Figure 17-2. On the graph, MS represents![]()
Unlock this Answer For Free Now!
View this answer and more for free by performing one of the following actions

Scan the QR code to install the App and get 2 free unlocks

Unlock quizzes for free by uploading documents