Figure 17-3. On the graph, MS represents the money supply and MD represents money demand. The usual quantities are measured along the axes. 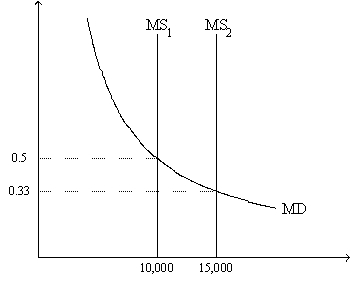
-Refer to Figure 17-3. Which of the following events could explain a shift of the money-supply curve from MS1 to MS2?
A) an increase in the value of money
B) a decrease in the price level
C) an open-market purchase of bonds by the Federal Reserve
D) None of the above is correct.
Correct Answer:
Verified
Q48: In the fourteenth century,the Western African Emperor
Q52: The economy of Mainland uses gold as
Q73: When the money market is drawn with
Q81: Figure 17-3. On the graph, MS represents
Q82: Figure 17-3. On the graph, MS represents
Q84: Figure 17-2. On the graph, MS represents
Q85: Figure 17-3. On the graph, MS represents
Unlock this Answer For Free Now!
View this answer and more for free by performing one of the following actions

Scan the QR code to install the App and get 2 free unlocks

Unlock quizzes for free by uploading documents