Figure 15.2 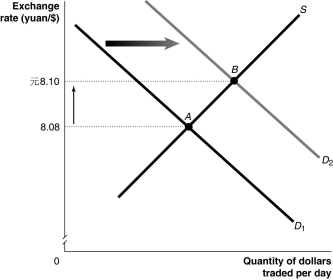 Alt text for Figure 15.2: In figure 15.2, a graph illustrates the quantity of dollars traded against the exchange rate.
Long description for Figure 15.2: The x-axis is labelled, quantity of dollars traded per day.The y-axis is labelled, exchange rate, yuan against the Canadian dollar, with values 8.08 yaun and 8.10 yaun marked.Supply curve S is a straight line which slopes up from the bottom left corner to the top right corner.2 parallel straight line demand curves, D1 and D2 slope down from the top left corner to the bottom right corner, with curve D2 plotted to the right of curve D1.Curve S intersects curve D1 at point A, with a y-axis value of 8.08 yaun.Curve S intersects curve D2 at point B, with a y-axis value of 8.10 yuan.Points A and B are connected to their corresponding values on the y-axis with dotted lines.The difference between the y-axis values is indicated with a up pointing arrow.
-Refer to Figure 15.2.Which of the following would cause the change depicted in the figure above?
A) Lack of investment in infrastructure causes Canadian productivity to fall relative to Chinese productivity.
B) Tainted cat food from China causes Canadian consumers to decrease their preferences for Chinese goods relative to Canadian goods.
C) A new trade agreement with China results in Canada removing all tariffs on clothing imported from China.
D) An expansionary monetary policy causes an increase in the price level of Canadian goods relative to Chinese goods.
E) The Chinese yuan becomes recognized as an international reserve currency.
Correct Answer:
Verified

