Multiple Choice
Graph 10-2
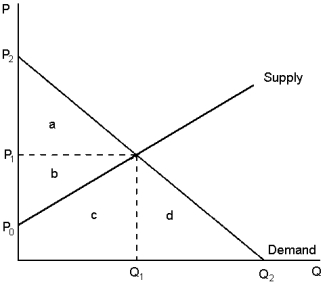 This graph depicts the market for pork. Use this information to answer the following question(s) .
-In Graph 10-2, consumer surplus would be maximised at what price and quantity combination?
A) P1, Q1
B) P2, quantity of zero
C) price of zero, Q2
D) P0, Q2
Correct Answer:
Verified
Related Questions
Q75: Suppose that water pollution creates a negative
Q76: Hikers frequently claim that livestock grazing in
Q78: Suppose people plant flowering trees near their
Q78: At any given quantity, the height of
Q80: The height of the supply curve at

