Graph 10-3
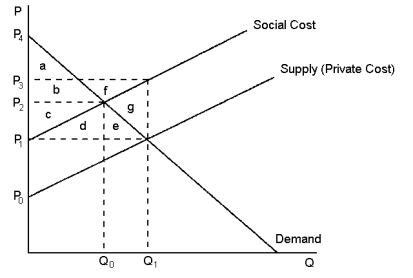 This graph reflects the market for kiwifruit, where pesticide used by kiwifruit orchardists also unintentionally kills honey bees.
-Refer to Graph 10-3. What price and quantity combination best represents the optimum price and number of kiwifruit trays that should be produced?
A) P1, Q1
B) P2, Q0
C) P3, Q1
D) The optimum quantity is zero kiwifruit as long as honey production by beekeepers is lower because of pesticide use.
Correct Answer:
Verified
Q76: Hikers frequently claim that livestock grazing in
Q78: Suppose people plant flowering trees near their
Q78: At any given quantity, the height of
Q80: Graph 10-2 Q80: The height of the supply curve at Unlock this Answer For Free Now! View this answer and more for free by performing one of the following actions Scan the QR code to install the App and get 2 free unlocks Unlock quizzes for free by uploading documents
![]()

