Table 4-4
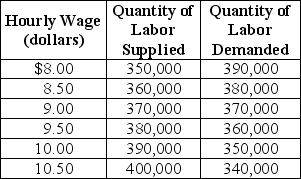 Table 4-4 shows the demand and supply schedules for the low-skilled labor market in the city of Westover.
-Refer to Table 4-4.Suppose that the quantity of labor demanded decreases by 40,000 at each wage level.What are the new free market equilibrium hourly wage and the new equilibrium quantity of labor?
A) W = $10.00; Q = 390,000
B) W = $9.50; Q = 380,000
C) W = $8.50; Q = 340,000
D) W = $8.00; Q = 350,000
Correct Answer:
Verified
Q114: Table 4-4 Q115: When _ in a market,the total net Q116: Table 4-4 Q117: Table 4-4 Q118: Table 4-4 Q120: What is deadweight loss? When is deadweight Q121: Figure 4-6 Q122: _ dictates the lowest wage that firms Q123: In order to be binding,a price floor Q124: Figure 4-5 Unlock this Answer For Free Now! View this answer and more for free by performing one of the following actions Scan the QR code to install the App and get 2 free unlocks Unlock quizzes for free by uploading documents
![]()
![]()
![]()
![]()
![]()
A)must![]()

