Multiple Choice
Table 4-4
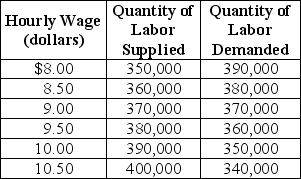 Table 4-4 shows the demand and supply schedules for the low-skilled labor market in the city of Westover.
-Refer to Table 4-4.Suppose that the quantity of labor supplied decreases by 40,000 at each wage level.What are the new free market equilibrium hourly wage and the new equilibrium quantity of labor?
A) W = $9.00; Q = 330,000
B) W = $9.50; Q = 370,000
C) W = $10.00; Q = 350,000
D) W = $8.00; Q = 390,000
Correct Answer:
Verified
Related Questions

