Multiple Choice
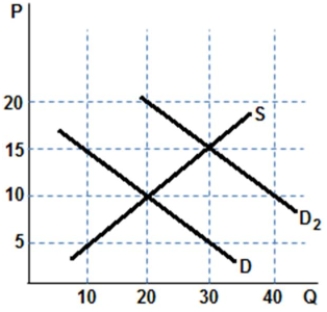 Assume the graph shown represents the market for bottles of wine and was originally in equilibrium with D and S.Something changes and demand shifts to D2.Which of the following is true?
A) Equilibrium price increased by $5.
B) Equilibrium quantity increased by 20.
C) Equilibrium price increased by $15.
D) Equilibrium quantity increased by 30.
Correct Answer:
Verified
Related Questions
Q140: The market clearing price refers to the:
A)
Q141: This table shows the demand and supply
Q142: Consider the market for ride-on lawn mowers

