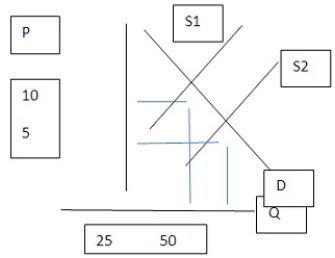
 Assume the graph shown represents the market for pizzas sold in an hour.If the original equilibrium was D and S1.Which of the following is true when S1 shifted to S2?
A) Equilibrium price decreased by $5.
B) Equilibrium quantity increased by 20.
C) Equilibrium price increased by $5.
D) Equilibrium quantity increased by 30.
Correct Answer:
Verified
Q141: This table shows the demand and supply
Q142: Consider the market for ride-on lawn mowers
Q143: Q144: This table shows the demand and supply Q145: Q147: Q148: Q149: Consider the market for ride-on lawn mowers Q150: This table shows the demand and supply Q151: Unlock this Answer For Free Now! View this answer and more for free by performing one of the following actions Scan the QR code to install the App and get 2 free unlocks Unlock quizzes for free by uploading documents![]()
![]()
![]()
![]()
![]()

