Multiple Choice
 Assume the graph shown represents the market for pizzas sold in an hour.Which of the following could be a reason S2 to S1?
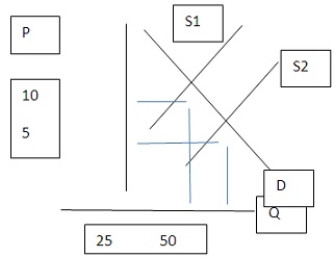
A) The price of pizza sauce has increased.
B) The price of pizza went down.
C) The price of labor for pizza shops went down.
D) People just don't have preferences for pizza anymore.
Correct Answer:
Verified
Related Questions

