Multiple Choice
The figure below shows the demand schedule and demand curve for a product produced by a single-price monopolist. 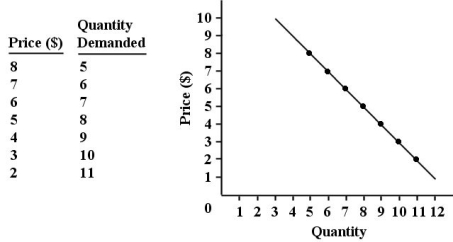 FIGURE 10-1
-Refer to Figure 10-1.What is the level of output at which marginal revenue first becomes negative?
A) 5th unit
B) 6th unit
C) 7th unit
D) 8th unit
E) 9th unit
Correct Answer:
Verified
Related Questions
Q14: Q15: Consider a profit-maximizing single-price monopolist that faces Q16: The average revenue curve for a single-price Unlock this Answer For Free Now! View this answer and more for free by performing one of the following actions Scan the QR code to install the App and get 2 free unlocks Unlock quizzes for free by uploading documents![]()

