The diagram below shows the demand curve facing a single-price monopolist. 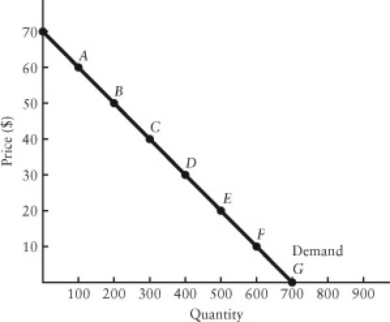 FIGURE 10-4
-Refer to Figure 10-4.What is the firm's marginal revenue per unit as it moves from point A to point B on the demand curve?
A) $0
B) $40
C) $50
D) $1000
E) $2000
Correct Answer:
Verified
Q17: Q18: Q19: The figure below shows the demand schedule Q20: A monopoly is distinguished from a firm Q21: Consider a single-price monopolist that is operating Q23: Consider the following AR and MR curves Q24: The diagram below shows total revenue for Q25: The diagram below shows the demand curve Q26: A monopolist faces a straight-line demand curve Q27: For a monopolist,the profit-maximizing level of output![]()
![]()
Unlock this Answer For Free Now!
View this answer and more for free by performing one of the following actions

Scan the QR code to install the App and get 2 free unlocks

Unlock quizzes for free by uploading documents