The diagram below shows total revenue for a single-price monopolist. 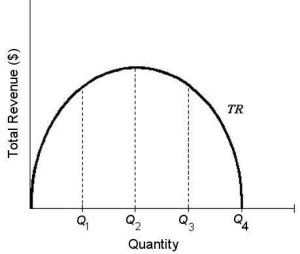 FIGURE 10-3
-Refer to Figure 10-3.The price elasticity of demand at Q3 is
A) zero.
B) less than 1.
C) equal to 1.
D) greater than 1.
E) not determinable from the diagram.
Correct Answer:
Verified
Q19: The figure below shows the demand schedule
Q20: A monopoly is distinguished from a firm
Q21: Consider a single-price monopolist that is operating
Q22: The diagram below shows the demand curve
Q23: Consider the following AR and MR curves
Q25: The diagram below shows the demand curve
Q26: A monopolist faces a straight-line demand curve
Q27: For a monopolist,the profit-maximizing level of output
Q28: Consider a profit-maximizing single-price monopolist that faces
Q29: Consider the following AR and MR curves
Unlock this Answer For Free Now!
View this answer and more for free by performing one of the following actions

Scan the QR code to install the App and get 2 free unlocks

Unlock quizzes for free by uploading documents