The diagram below shows the marginal cost of pollution abatement for two firms,Firm X and Firm Y. 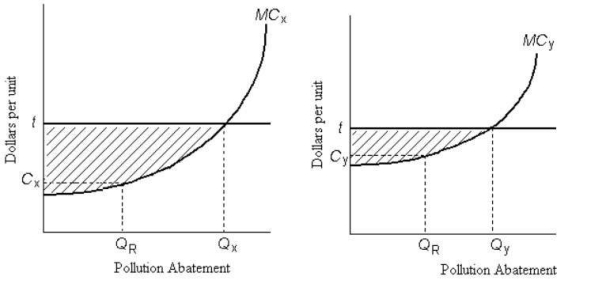 FIGURE 17-6
-Refer to Figure 17-6.Firms X and Y have an emissions tax of $t imposed on each unit of pollution they produce.If Firm X chooses to abate QX units of pollution,the total cost of its abatement is
A) tax amount t multiplied by the maximum possible level of pollution abatement.
B) area beneath the marginal cost of pollution abatement curve.
C) area below the horizontal line at t and above the MC of pollution abatement curve.
D) tax amount t multiplied by the level of pollution abatement,QX.
E) area beneath the marginal cost of pollution abatement curve up to QX.
Correct Answer:
Verified
Q81: The diagram below shows the marginal costs
Q82: The diagram below shows the marginal costs
Q83: The diagram below shows the marginal cost
Q84: Suppose the government imposes a tax for
Q85: The diagram below shows the marginal costs
Q87: Suppose the government imposes an emissions tax
Q88: The diagram below shows the marginal costs
Q89: Two firms,A and B,are legally required to
Q90: An emissions tax (imposed on each unit
Q91: The diagram below shows the marginal cost
Unlock this Answer For Free Now!
View this answer and more for free by performing one of the following actions

Scan the QR code to install the App and get 2 free unlocks

Unlock quizzes for free by uploading documents