The diagram below shows the marginal cost of pollution abatement for two firms,Firm X and Firm Y. 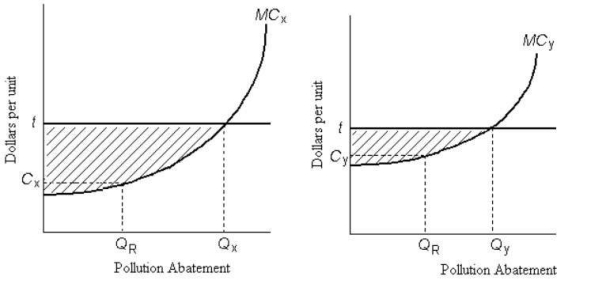 FIGURE 17-6
-Refer to Figure 17-6.There is an emissions tax of $t per unit of pollution.The resulting amount of pollution abatement is socially optimal if
A) Firm X abates QX and Firm Y abates QY.
B) each firm abates at QR.
C) the emissions tax causes no change in firms' polluting activity.
D) the emissions tax is equal to the marginal social cost of pollution.
E) each firm pays the maximum amount of tax.
Correct Answer:
Verified
Q78: The table below shows the marginal costs
Q79: Direct controls for reducing pollution can be
Q80: An important reason that direct controls are
Q81: The diagram below shows the marginal costs
Q82: The diagram below shows the marginal costs
Q84: Suppose the government imposes a tax for
Q85: The diagram below shows the marginal costs
Q86: The diagram below shows the marginal cost
Q87: Suppose the government imposes an emissions tax
Q88: The diagram below shows the marginal costs
Unlock this Answer For Free Now!
View this answer and more for free by performing one of the following actions

Scan the QR code to install the App and get 2 free unlocks

Unlock quizzes for free by uploading documents