The diagram below shows the marginal costs of pollution abatement for two firms,Firm 1 and Firm 2. 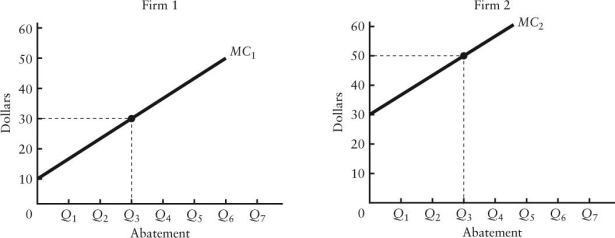 FIGURE 17-5
-Refer to Figure 17-5.Suppose Firm 1 and Firm 2 are each abating Q3 units of pollution.If the government imposed an emissions tax of $40 per unit of emissions,
A) each firm would abate to Q3.
B) each firm would abate to the same level.
C) Firm 1 would increase abatement beyond Q3 and Firm 2 would abate less than Q3.
D) Firm 2 would increase abatement beyond Q3 and Firm 1 would abate less than Q3.
E) the level of pollution would be optimal.
Correct Answer:
Verified
Q83: The diagram below shows the marginal cost
Q84: Suppose the government imposes a tax for
Q85: The diagram below shows the marginal costs
Q86: The diagram below shows the marginal cost
Q87: Suppose the government imposes an emissions tax
Q89: Two firms,A and B,are legally required to
Q90: An emissions tax (imposed on each unit
Q91: The diagram below shows the marginal cost
Q92: Suppose a per-unit tax is imposed on
Q93: A pollution-control policy that,in principle,can perfectly internalize
Unlock this Answer For Free Now!
View this answer and more for free by performing one of the following actions

Scan the QR code to install the App and get 2 free unlocks

Unlock quizzes for free by uploading documents