This graph shows the marginal cost and marginal benefit associated with roadside litter clean up. Assume that the marginal benefit curve and marginal cost curve each have their usual slope. 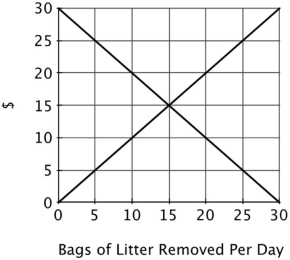 The marginal cost of litter removal ______ due to ______.
A) decreases; gains from specialization
B) increases; the Coase Theorem
C) increases; increasing opportunity costs
D) decreases; diminishing returns to inputs
Correct Answer:
Verified
Q62: Refer to the figure below. If negotiation
Q64: This graph shows the marginal cost and
Q65: This graph shows the marginal cost and
Q66: Refer to the figure below. From this
Q68: This graph shows the marginal cost and
Q69: Refer to the figure below. The socially
Q70: Refer to the figure below. At the
Q71: The essential cause of the tragedy of
Q72: This graph shows the marginal cost and
Q84: The tragedy of the commons refers to
Unlock this Answer For Free Now!
View this answer and more for free by performing one of the following actions

Scan the QR code to install the App and get 2 free unlocks

Unlock quizzes for free by uploading documents