Refer to the figure below. From this graph, you can infer that paper production: 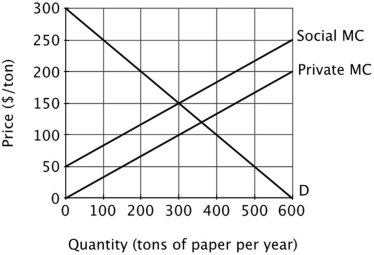
A) generates no externalities at quantities less than 300 tons per day.
B) generates an external cost of $50 per ton per year.
C) generates an external cost of $150 per ton per year.
D) should be prohibited.
Correct Answer:
Verified
Q62: Refer to the figure below. If negotiation
Q64: This graph shows the marginal cost and
Q65: This graph shows the marginal cost and
Q67: This graph shows the marginal cost and
Q68: This graph shows the marginal cost and
Q69: Refer to the figure below. The socially
Q70: Refer to the figure below. At the
Q71: The essential cause of the tragedy of
Q84: The tragedy of the commons refers to
Q112: Since the cost of using more of
Unlock this Answer For Free Now!
View this answer and more for free by performing one of the following actions

Scan the QR code to install the App and get 2 free unlocks

Unlock quizzes for free by uploading documents