Refer to the figure below. The socially optimal quantity of paper is ______ tons per year. 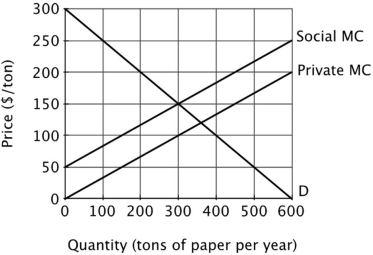
A) 0
B) 360
C) 150
D) 300
Correct Answer:
Verified
Q64: This graph shows the marginal cost and
Q65: This graph shows the marginal cost and
Q66: Refer to the figure below. From this
Q67: This graph shows the marginal cost and
Q68: This graph shows the marginal cost and
Q70: Refer to the figure below. At the
Q71: The essential cause of the tragedy of
Q72: This graph shows the marginal cost and
Q73: Refer to the figure below. This graph
Q100: Which of the following would be most
Unlock this Answer For Free Now!
View this answer and more for free by performing one of the following actions

Scan the QR code to install the App and get 2 free unlocks

Unlock quizzes for free by uploading documents