Multiple Choice
FIGURE 12-5 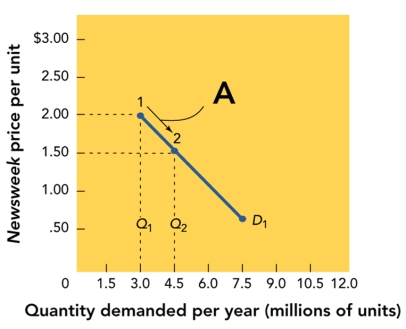
-Figure 12-5 above shows that when the price moves from $2.00 to $1.50 per unit, the quantity demanded increases from 3 million to 4.5 million.This is an example of a
A) shift of demand curve.
B) scaling back a demand curve.
C) price elasticity curve.
D) price inelasticity curve.
E) movement along a demand curve.
Correct Answer:
Verified
Related Questions
Q162: Factors that determine consumers' willingness and ability
Q163: FIGURE 12-6 Q164: FIGURE 12-6 Q165: The maximum quantity of products consumers will Unlock this Answer For Free Now! View this answer and more for free by performing one of the following actions Scan the QR code to install the App and get 2 free unlocks Unlock quizzes for free by uploading documents![]()
![]()

