Multiple Choice
FIGURE 12-6 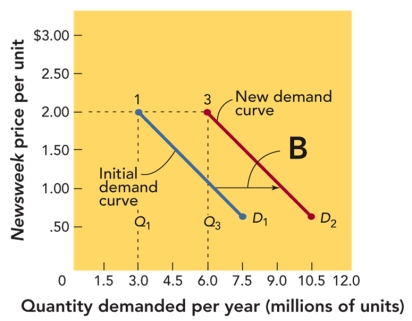
-Figure 12-6 above shows that when the quantity demanded moves from 3.0 to 6 million units, the profit
A) increases from $1.50 to $2.00 per unit.
B) decreases from $2.00 to $1.50 per unit.
C) stays the same per unit.
D) increases from $.50 to $1.50 per unit.
E) Figure 12-6 does not indicate what happens to profit when the quantity demanded moves.
Correct Answer:
Verified
Related Questions
Q159: An ad campaign by Suave shampoo asked
Q160: Companies use a " _ " to
Q161: Marketing executives must translate estimates of customer
Q162: Factors that determine consumers' willingness and ability

