Multiple Choice
FIGURE 2-4 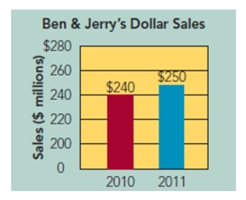
-A marketing manager for Ben and Jerry's, has been provided with a dashboard display for business activity.In Figure 2-4 above, notice that dollar sales for 2010 were $240 million and in 2011 they were $250 million.What simple formula was used to calculate the dollar sales for each of these years?
A) Dollar sales ($) = average price multiplied by quantity sold.
B) Dollar sales ($) = average price multiplied by quantity manufactured.
C) Dollar sales ($) = average cost of goods sold minus fixed costs.
D) Dollar sales ($) = average cost of goods sold minus variable costs.
E) Dollar sales ($) = average price minus shrinkage rate.
Correct Answer:
Verified
Related Questions

