Multiple Choice
FIGURE 2-3 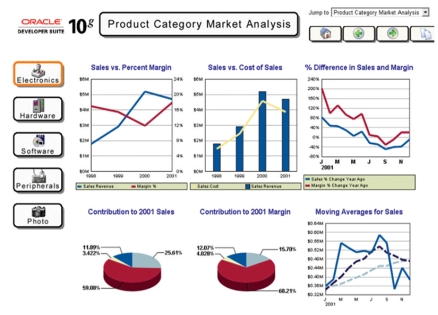
-According to Figure 2-3 above, in what time increments does the dashboard represent the % difference in sales and margins?
A) every day
B) every week
C) every month
D) every two months
E) four times a year
Correct Answer:
Verified
Related Questions
Q129: FIGURE 2-3 Q130: Which of the following statements regarding a![]()

