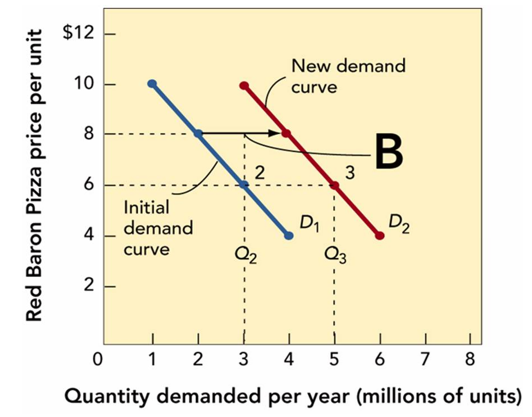
-In Figure 11-3B above, the demand curve shifts from D1 to D2. This most likely represents
A) an increase in demand that did not require a change in price but was the result of a change in one or more demand factors.
B) an increase in demand that required a decrease in price.
C) no change in price and a decrease in demand that results from internal business practice changes.
D) no change in demand or price but a greater profit due to economies of scale.
E) an decrease in price from $8 to $6 per unit.
Correct Answer:
Verified
Q141: Several companies produce latex gloves that are
Q184: Q185: Q185: Demand factors refer to Q186: Q188: While the demand factors of consumer tastes Q189: Q190: All of the following are demand factors Q191: When estimating demand, price is not the Q192: Unlock this Answer For Free Now! View this answer and more for free by performing one of the following actions Scan the QR code to install the App and get 2 free unlocks Unlock quizzes for free by uploading documents![]()
![]()
A)the number of consumers![]()
![]()
![]()

