Multiple Choice
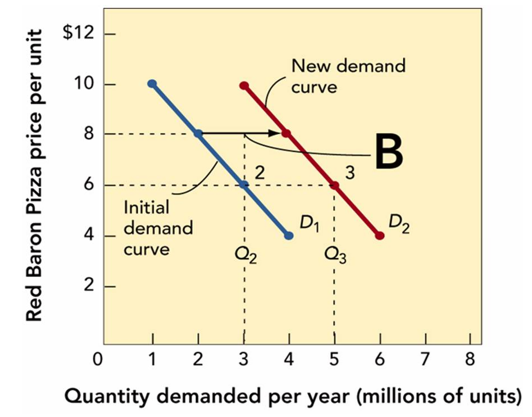
-Figure 11-3B above shows that when the quantity demanded for Red Baron frozen cheese pizzas moves from 2 to 3 million units from the demand curve D1 to the demand curve D2, the profit
A) Figure 11-3B does not indicate what happens to profit when the quantity demanded changes.
B) increases from $2 to $3 per unit.
C) stays the same per unit.
D) increases from $6 to $8 per unit.
E) decreases from $8 to $6 per unit.
Correct Answer:
Verified
Related Questions
Q146: Price elasticity of demand (E)is expressed as
Q151: Basic to setting a product's price is

