Multiple Choice
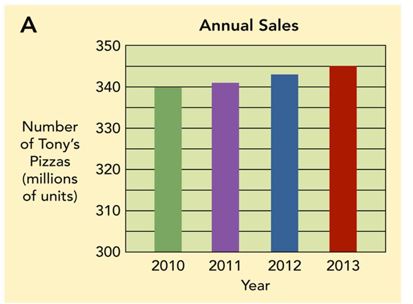
-Figure 7-6A above indicates that
A) U.S. children ate more pizzas between the years 2010 and 2013.
B) annual sales of Tony's Pizza grew significantly over the period 2010 to 2013.
C) households with two or more members ate more Tony's Pizza over the period 2010 to 2013, which drove a sales increase.
D) annual sales of Tony's Pizza grew slightly over the period 2010 to 2013.
E) there was a greater change in growth in the monthly sales of Tony's Pizza between 2010 and 2011 than there was between 2012 and 2013.
Correct Answer:
Verified
Related Questions
Q224: Many consumers buy soft drinks and potato

