Shown below is a concentration vs.time plot for the reaction A ⇌ 2B.For this reaction the value of the equilibrium constant is 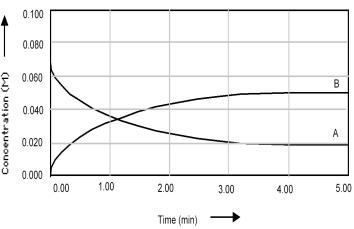
A) Kc < 1.
B) Kc = 0.
C) Kc = 1.
D) Kc > 1.
Correct Answer:
Verified
Q85: The reaction A2 + B2 ⇌ 2AB
Q86: The reaction A2 + B2 ⇌ 2AB
Q93: Consider the reaction A + B ⇌
Q96: The following pictures represent the initial state
Q104: Shown below is a concentration vs.time plot
Q105: Shown below is a concentration vs.time plot
Q107: The following pictures represent mixtures of A2B4
Q108: Shown below is a concentration vs.time plot
Q110: The following picture represents the equilibrium state
Q111: Shown below is a concentration vs.time plot
Unlock this Answer For Free Now!
View this answer and more for free by performing one of the following actions

Scan the QR code to install the App and get 2 free unlocks

Unlock quizzes for free by uploading documents