Shown below is a concentration vs.time plot for the reaction A ⇌ 2B.For this reaction the value of the equilibrium constant is 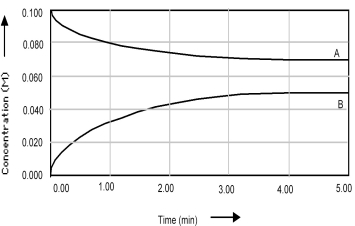
A) Kc < 1.
B) Kc = 0.
C) Kc = 1.
D) Kc > 1.
Correct Answer:
Verified
Q63: Consider the interconversion of A molecules (shaded
Q79: At 25°C,a certain first order reaction has
Q95: Picture (1)represents the equilibrium mixture for the
Q96: The following pictures represent the initial state
Q102: The following pictures represent mixtures of cis-C2H2X2
Q103: The following pictures represent mixtures of cis-C2H2X2
Q105: Shown below is a concentration vs.time plot
Q107: The following pictures represent mixtures of A2B4
Q108: Shown below is a concentration vs.time plot
Q109: Shown below is a concentration vs.time plot
Unlock this Answer For Free Now!
View this answer and more for free by performing one of the following actions

Scan the QR code to install the App and get 2 free unlocks

Unlock quizzes for free by uploading documents