A college admissions officer in the U.S.A. ,defending the college's use of SAT scores in the admissions process,produced the graph below.It represents the mean GPAs for last year's freshmen,grouped by SAT scores.It shows that increased SAT score is associated with increased GPA.What concerns you about the graph,the statistical methodology,or the conclusion reached? 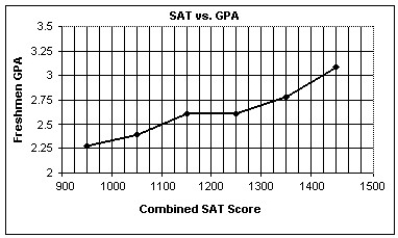
A) The statistical methodology is a concern,because SAT is not an adequate predictor of GPA on average.
B) The conclusion reached is a concern,because it should be increased GPA is associated with increased SAT score.
C) The conclusion reached is a concern,because there are no relationships between SAT scores and GPA.
D) The statistical methodology is a concern,because there may be lurking variables.
E) The statistical methodology is a concern,because the GPA data is based on mean GPAs,not individual data.We also don't know the number of students in each SAT category.
Correct Answer:
Verified
Q22: A reporter studied the causes of a
Q23: An economist noticed that nations with more
Q24: Which of the following scatterplots of residuals
Q25: Which of the following scatterplots of residuals
Q26: ,The total home-game attendance for major-league baseball
Q27: A study of consumer behavior finds a
Q29: Which of the following scatterplots of residuals
Q30: A study finds a strong positive association
Q31: The data in the table below can
Q32: Which of the following scatterplots of residuals
Unlock this Answer For Free Now!
View this answer and more for free by performing one of the following actions

Scan the QR code to install the App and get 2 free unlocks

Unlock quizzes for free by uploading documents