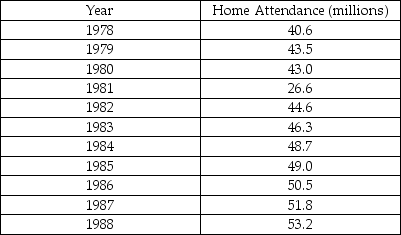
,The total home-game attendance for major-league baseball is the sum of all attendees for all stadiums during the entire season.The home attendance (in millions)for a number of years is shown in the table below.
a)Make a scatterplot showing the trend in home attendance.Describe what you see. 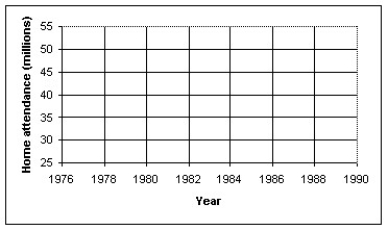
b)Determine the correlation,and comment on its significance.
c)Find the equation of the line of regression.Interpret the slope of the equation.
d)Use your model to predict the home attendance for 1998.How much confidence do you have in this prediction? Explain.
e)Use the internet or other resource to find reasons for any outliers you observe in the scatterplot.
Correct Answer:
Verified
The data show a strong as...
View Answer
Unlock this answer now
Get Access to more Verified Answers free of charge
Q22: A reporter studied the causes of a
Q23: An economist noticed that nations with more
Q24: Which of the following scatterplots of residuals
Q25: Which of the following scatterplots of residuals
Q27: A study of consumer behavior finds a
Q28: A college admissions officer in the U.S.A.
Q29: A university studied students' grades and established
Q29: Which of the following scatterplots of residuals
Q30: A study finds a strong positive association
Q31: The data in the table below can
Unlock this Answer For Free Now!
View this answer and more for free by performing one of the following actions

Scan the QR code to install the App and get 2 free unlocks

Unlock quizzes for free by uploading documents