The data in the table below can be used to explore the association between the rate of television ownership and per capita gross domestic product for several countries.
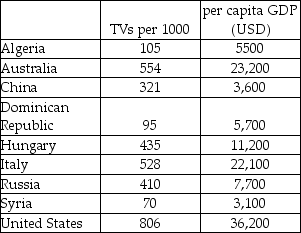
a)Make a scatterplot showing the trend in television ownership versus per capita GDP.Describe what you see. 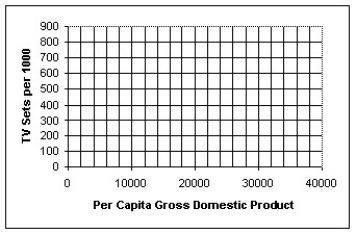
b)Determine the correlation and comment on its significance.
c)Find the equation of the line of regression.Interpret the slope of the equation.
d)Use your model to predict the rate of TV ownership for India,which has a per capita GDP of $2,200.How much confidence do you have in this prediction? Explain.
e)Discuss the impact that the U.S.A.data exerts on the model.
Correct Answer:
Verified
b)R2 = 0.8124.The associat...
View Answer
Unlock this answer now
Get Access to more Verified Answers free of charge
Q22: A reporter studied the causes of a
Q23: An economist noticed that nations with more
Q24: Which of the following scatterplots of residuals
Q25: Which of the following scatterplots of residuals
Q26: ,The total home-game attendance for major-league baseball
Q27: A study of consumer behavior finds a
Q28: A college admissions officer in the U.S.A.
Q29: Which of the following scatterplots of residuals
Q30: A study finds a strong positive association
Q32: Which of the following scatterplots of residuals
Unlock this Answer For Free Now!
View this answer and more for free by performing one of the following actions

Scan the QR code to install the App and get 2 free unlocks

Unlock quizzes for free by uploading documents