The following diagram represents the reaction of A2 (unshaded spheres) with B2 (shaded spheres) .How many moles of product can be produced from the reaction of 1.0 mol of A2 and 1.0 mol of B2? 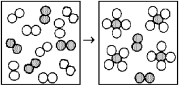
A) 0.5 mol of product
B) 1.0 mol of product
C) 2.0 mol of product
D) 4.0 mol of product
Correct Answer:
Verified
Q61: The following diagram represents the reaction of
Q62: What is the balanced chemical equation for
Q63: Q64: What is the balanced chemical equation for Q65: Reaction of A (unshaded spheres)with B2 (shaded Q67: What is the stoichiometric coefficient for oxygen Q68: The following diagrams represent the reaction of Q69: The following diagrams represent the reaction of Q70: The following diagram represents the reaction of Q71: ![]()
![]()
Unlock this Answer For Free Now!
View this answer and more for free by performing one of the following actions

Scan the QR code to install the App and get 2 free unlocks

Unlock quizzes for free by uploading documents