The following diagram shows a close-up view of the vapor pressure curves for a pure solvent and a solution containing a nonvolatile solute dissolved in this solvent. 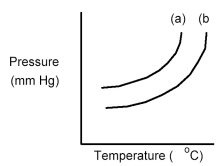
-Which curve is the solvent and what happens to the boiling point when the solute is dissolved in the solvent?
A) Curve (a) is the solvent and the boiling point decreases.
B) Curve (a) is the solvent and the boiling point increases.
C) Curve (b) is the solvent and the boiling point decreases.
D) Curve (b) is the solvent and the boiling point increases.
Correct Answer:
Verified
Q83: Q84: The following diagram shows a close-up view Q85: Drawings (1)and (2)show the equilibrium vapor pressures Q87: Arrows in the energy diagram below represent Q89: Drawing (1)shows a system in which an![]()
Unlock this Answer For Free Now!
View this answer and more for free by performing one of the following actions

Scan the QR code to install the App and get 2 free unlocks

Unlock quizzes for free by uploading documents