The following diagram is a cost-volume-profit graph for a manufacturing company:
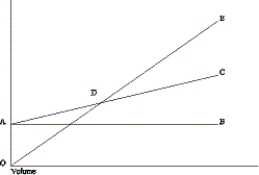
-Refer to the figure.Which of the following statements best describes the labelled item on the diagram?
A) Area CDE represents the area of net loss.
B) Line AC graphs the total fixed costs.
C) Point D is where contribution margin increases.
D) Line AC graphs the total costs.
Correct Answer:
Verified
Q49: Assume the following cost behaviour data
Q50: Patricia Company produces two products,X and Y,which
Q50: How are income taxes treated in cost-volume-profit
Q51: Information about the Harmon Company's two
Q53: In a cost-volume-profit graph,what does the slope
Q55: Product 1 has a contribution margin of
Q56: The following diagram is a cost-volume-profit
Q57: How does sales mix impact profits?
A)Profits may
Q58: What is represented in a cost-volume-profit graph
Q59: The following diagram is a cost-volume-profit graph
Unlock this Answer For Free Now!
View this answer and more for free by performing one of the following actions

Scan the QR code to install the App and get 2 free unlocks

Unlock quizzes for free by uploading documents