The following diagram is a cost-volume-profit graph for a manufacturing company:
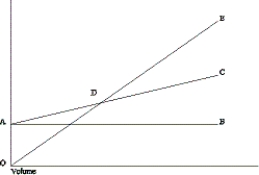
-Refer to the figure.What is the difference between line AB and line AC (area BAC) ?
A) the contribution ratio
B) the total variable cost
C) the contribution margin per unit
D) the total fixed cost
Correct Answer:
Verified
Q54: The following diagram is a cost-volume-profit graph
Q55: Product 1 has a contribution margin of
Q56: The following diagram is a cost-volume-profit
Q57: How does sales mix impact profits?
A)Profits may
Q58: What is represented in a cost-volume-profit graph
Q60: What does the term "sales mix" refer
Q61: Which of the following assumptions is necessary
Q62: In a cost-volume-profit graph,what does the slope
Q63: Dirth Company sells only one product at
Q64: What happens when a company sells more
Unlock this Answer For Free Now!
View this answer and more for free by performing one of the following actions

Scan the QR code to install the App and get 2 free unlocks

Unlock quizzes for free by uploading documents