The following diagram is a cost-volume-profit graph for a manufacturing company: 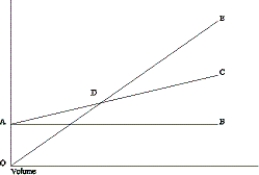
What is the formula to determine the Y-axis value ($) at point D on the graph?
A) Fixed costs + (Variable costs per unit * Number of units)
B) XY - b X
C) Fixed costs/Unit contribution margin
D) Fixed costs/Contribution margin ratio
Correct Answer:
Verified
Q50: Patricia Company produces two products,X and Y,which
Q51: Information about the Harmon Company's two
Q53: In a cost-volume-profit graph,what does the slope
Q54: The following diagram is a cost-volume-profit graph
Q55: Product 1 has a contribution margin of
Q57: How does sales mix impact profits?
A)Profits may
Q58: What is represented in a cost-volume-profit graph
Q59: The following diagram is a cost-volume-profit graph
Q60: What does the term "sales mix" refer
Q61: Which of the following assumptions is necessary
Unlock this Answer For Free Now!
View this answer and more for free by performing one of the following actions

Scan the QR code to install the App and get 2 free unlocks

Unlock quizzes for free by uploading documents