The figure shows a graph of the temperature of a pure substance as a function of time as energy through heating is added to it at a constant rate in a closed container.If LF is the latent heat of fusion of this substance and LV is its latent heat of vaporization,what is the value of the ratio LV/LF? 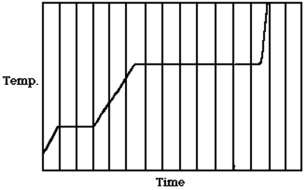
A) 5.0
B) 4.5
C) 7.2
D) 3.5
E) 1.5
Correct Answer:
Verified
Q2: A solid cylindrical bar conducts thermal energy
Q4: Object 1 has three times the
Q5: The process shown on the pV diagram
Q6: Object 1 has three times the
Q7: If,with steady state thermal energy flow
Q8: An architect is interested in estimating the
Q9: A thermally isolated system is made up
Q10: The process in which thermal energy flows
Q11: In a given reversible process,the temperature of
Q18: An ideal gas is compressed isothermally to
Unlock this Answer For Free Now!
View this answer and more for free by performing one of the following actions

Scan the QR code to install the App and get 2 free unlocks

Unlock quizzes for free by uploading documents