An architect is interested in estimating the rate of energy loss through heating,ΔQ/Δt,through a sheet of insulating material as a function of the thickness of the sheet.Assuming fixed temperatures on the two faces of the sheet and steady state thermal energy flow,which one of the graphs shown in the figure best represents the rate of thermal energy transfer as a function of the thickness of the insulating sheet? 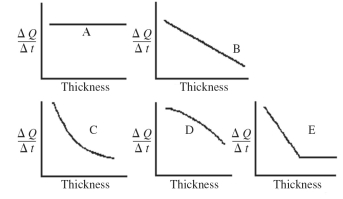
A) A
B) B
C) C
D) D
E) E
Correct Answer:
Verified
Q3: The figure shows a graph of the
Q4: Object 1 has three times the
Q5: The process shown on the pV diagram
Q6: Object 1 has three times the
Q7: If,with steady state thermal energy flow
Q9: A thermally isolated system is made up
Q10: The process in which thermal energy flows
Q11: In a given reversible process,the temperature of
Q12: The process shown on the pV diagram
Q13: An ideal gas is compressed isobarically to
Unlock this Answer For Free Now!
View this answer and more for free by performing one of the following actions

Scan the QR code to install the App and get 2 free unlocks

Unlock quizzes for free by uploading documents