The figure shows a pV diagram for a gas going through a cycle from A to B to C and back to A.From point A to point B,the gas absorbs 50 J of energy through heating and finds its internal (thermal)energy has increased by 20 J.Going from B to C,the internal (thermal)energy decreases by 5.0 J.
(a)How much work was done in the gas from A to B?
(b)How much energy through heating was absorbed by the gas from B to C?
(c)How much work was done on the gas going from B to C? 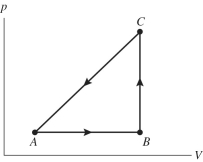
Correct Answer:
Verified
...
View Answer
Unlock this answer now
Get Access to more Verified Answers free of charge
Q77: A 40.0-L container is divided into two
Q110: An external heat source supplies thermal energy
Q111: A gas expands from an initial volume
Q112: In an isochoric process,the internal (thermal)energy of
Q113: The gas in a perfectly insulated
Q114: During an isochoric process,the internal (thermal)energy of
Q115: An athlete doing push-ups performs 650 kJ
Q116: An ideal gas undergoes the process
Q117: The figure shows a pV diagram
Q118: During an isothermal process,5.0 J of thermal
Unlock this Answer For Free Now!
View this answer and more for free by performing one of the following actions

Scan the QR code to install the App and get 2 free unlocks

Unlock quizzes for free by uploading documents