Figure 10-1 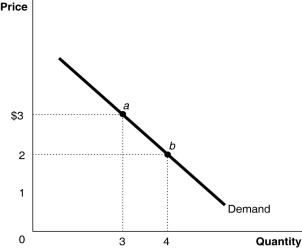 Figure 10-1 represents the demand for ice cream cones.
-Refer to Figure 10-1.Which of the following statements is true?
A) Points a and b are the utility-maximizing quantities of ice-cream cones at two different prices of ice-cream.
B) Points a and b may not necessarily be the utility-maximizing quantities of ice-cream cones at two different prices because we have no information on the consumer's budget or the price of other goods.
C) Point a could be a utility-maximizing choice if the price is $3 but point b may not be because we have no information on the marginal utility per dollar when price changes.
D) Points a and b are derived independently of the utility-maximizing model.
Correct Answer:
Verified
Q71: During the 2011 Super Bowl,Best Buy ran
Q76: Which of the following is not a
Q78: Figure 10-1 Q131: The demand for a Giffen good slopes Q138: For a demand curve to be upward Q149: What did economists Robert Jensen and Nolan Q160: Describe the demand curve for a Giffen Q169: The order of the letters along the Q175: Which of the following is used to Q178: Which of the following statements describes economists'![]()
Unlock this Answer For Free Now!
View this answer and more for free by performing one of the following actions

Scan the QR code to install the App and get 2 free unlocks

Unlock quizzes for free by uploading documents