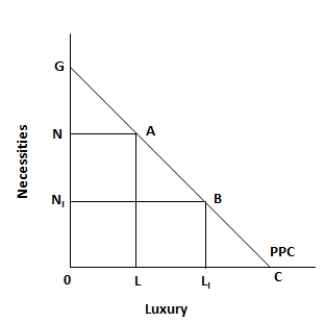
Figure 5.1. The figure shows a linear production possibility curve representing a tradeoff faced by a country, between necessities and luxuries. 
-Which of the following is a possible drawback of horizontal fracking?
A) A fall in the cost of recovering natural gas and oil
B) An increase in the price of gas and oil as a result of a decline in the supply of natural gas and oil
C) A fall in imports of natural gas and oil
D) A fall in environmental exploitation due to the means employed to extract oil
E) An increase in harmful air emissions, water contamination, and problems associated with the disposal of harmful waste fluids
Correct Answer:
Verified
Q15: Figure 5.1. The figure shows a linear
Q16: Scenario 4-1
In a given year, country A
Q17: Scenario 4-1
In a given year, country A
Q18: Figure 5.1. The figure shows a linear
Q19: Figure 5.1. The figure shows a linear
Q21: Figure 5.2. The figure shows the supply
Q22: Figure 5.2. The figure shows the supply
Q23: Figure 5.2. The figure shows the supply
Q24: Figure 5.2. The figure shows the supply
Q25: Figure 5.2. The figure shows the supply
Unlock this Answer For Free Now!
View this answer and more for free by performing one of the following actions

Scan the QR code to install the App and get 2 free unlocks

Unlock quizzes for free by uploading documents