Figure 5.2. The figure shows the supply and demand curves of a firm. 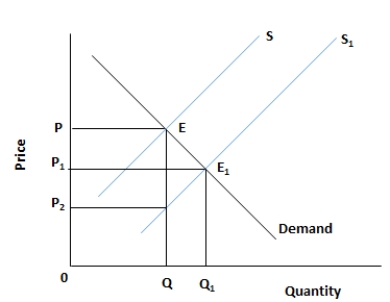
-Refer to figure 5.2. Which of the following will cause a shift in the supply curve from S to S1?
A) A decline in the cost of producing the commodity
B) An increase in the cost of producing the commodity
C) An increase in the price of the commodity
D) A decline in the price of the commodity
E) A leftward shift in the demand curve of the product
Correct Answer:
Verified
Q17: Scenario 4-1
In a given year, country A
Q18: Figure 5.1. The figure shows a linear
Q19: Figure 5.1. The figure shows a linear
Q20: Figure 5.1. The figure shows a linear
Q21: Figure 5.2. The figure shows the supply
Q23: Figure 5.2. The figure shows the supply
Q24: Figure 5.2. The figure shows the supply
Q25: Figure 5.2. The figure shows the supply
Q26: Figure 5.2. The figure shows the supply
Q27: Figure 5.2. The figure shows the supply
Unlock this Answer For Free Now!
View this answer and more for free by performing one of the following actions

Scan the QR code to install the App and get 2 free unlocks

Unlock quizzes for free by uploading documents