Figure 5.2. The figure shows the supply and demand curves of a firm. 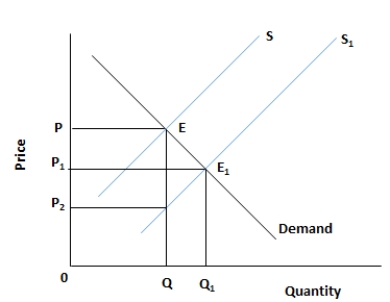
-Which of the following is true?
A) Sellers are willing to supply more of a good or service at every price after costs have increased.
B) A fall in the price of a product leads to an increase in the profits earned by sellers.
C) A fall in the cost of production leads to a downward movement along the supply curve of a product.
D) Sellers are willing to supply more of a good or service at every price after costs have decreased.
E) An increase in the price of a product leads to a fall in the profits earned by sellers.
Correct Answer:
Verified
Q16: Scenario 4-1
In a given year, country A
Q17: Scenario 4-1
In a given year, country A
Q18: Figure 5.1. The figure shows a linear
Q19: Figure 5.1. The figure shows a linear
Q20: Figure 5.1. The figure shows a linear
Q22: Figure 5.2. The figure shows the supply
Q23: Figure 5.2. The figure shows the supply
Q24: Figure 5.2. The figure shows the supply
Q25: Figure 5.2. The figure shows the supply
Q26: Figure 5.2. The figure shows the supply
Unlock this Answer For Free Now!
View this answer and more for free by performing one of the following actions

Scan the QR code to install the App and get 2 free unlocks

Unlock quizzes for free by uploading documents