Refer to the figure showing the steps used in microarray analysis to detect differences in expression between tumor tissue and normal tissue.The spots in the bottom panel represent individual genes for patients who have good prognoses (left) as well as for those who have poor ones (right).The colors of those spots represent levels of expression: red = high expression, yellow = intermediate expression, green = low expression. 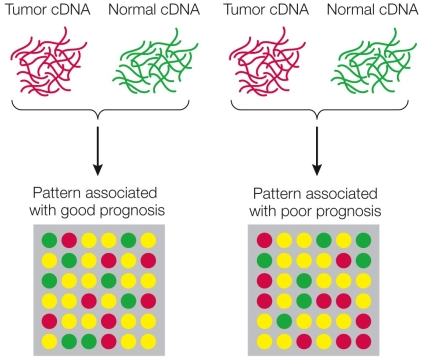 At what stage does hybridization with oligonucleotides occur?
Correct Answer:
Verified
View Answer
Unlock this answer now
Get Access to more Verified Answers free of charge
Q132: Which sequence is least likely to be
Q133: Refer to the figure showing the steps
Q134: Which DNA sequence forms a palindromic sequence?
A)
Q135: Refer to the figure showing how genomic
Q136: Refer to the table showing results from
Q138: In Cohen and Boyer's pioneering studies in
Q139: Refer to the table showing results from
Q140: The DNA sequence 5ʹ-AGCTCA-3ʹ is not a
Q141: Selectable markers are usually used in studies
Q142: A human gene is inserted into a
Unlock this Answer For Free Now!
View this answer and more for free by performing one of the following actions

Scan the QR code to install the App and get 2 free unlocks

Unlock quizzes for free by uploading documents