The histograms show the cost of living,in dollars,for 32 Canadian cities.The histogram on the left shows the cost of living for the 32 cities using bins $10 wide,and the histogram on the right displays the same data using bins that are $6 wide. 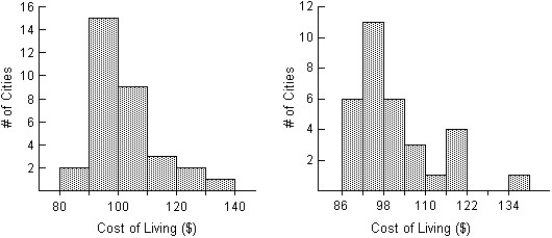 Compare the distributions (shape,centre,spread,unusual features) .
A) The distribution in the left histogram of the cost of living in the 32 Canadian cities is unimodal and skewed to the right.The distribution is centred around $100,and spread out,with values ranging from $80 to $140.The distribution in the right histogram appears bimodal,with many cities costing just under $104 and another smaller cluster around $119.There also appears to be an outlier in the right histogram at $134 that was not apparent in the histogram on the left.
B) The distribution in the left histogram of the cost of living in the 32 Canadian cities is unimodal and skewed to the right.The distribution is centred around $100,and spread out,with values ranging from $80 to $140.The distribution in the right histogram is unimodal and symmetric.The distribution is centred around $104,and spread out,with values ranging from $86 to $140.There also appears to be an outlier in the right histogram at $134 that was not apparent in the histogram on the left.
C) The distribution in the left histogram of the cost of living in the 32 Canadian cities is unimodal and skewed to the left.The distribution is centred around $100,and spread out,with values ranging from $80 to $140.The distribution in the right histogram appears bimodal,with many cities costing just under $104 and another smaller cluster around $119.There also appears to be an outlier in the right histogram at $134 that was not apparent in the histogram on the left.
D) The distribution in the left histogram of the cost of living in the 32 Canadian cities is unimodal and skewed to the right.The distribution is centred around $100,and spread out,with values ranging from $80 to $140.The distribution in the right histogram is also unimodal and skewed to the right.The distribution is centred around $104,and spread out,with values ranging from $86 to $140.There also appears to be an outlier in the right histogram at $134 that was not apparent in the histogram on the left.
E) The distribution in the left histogram of the cost of living in the 32 Canadian cities is unimodal and skewed to the right.The distribution is centred around $100,and spread out,with values ranging from $80 to $140.The distribution in the right histogram appears bimodal,with many cities costing just under $104 and another smaller cluster around $119.
Correct Answer:
Verified
Q8: Here are boxplots of the points scored
Q9: Describe what these boxplots tell you about
Q10: The histograms display the body fat percentages
Q11: Which class do you think performed better
Q12: Do men and women run a 5-kilometre
Q14: The centre for health in a certain
Q15: How would you describe the shape of
Q16: Which class had the smallest standard deviation?
A)Class
Q17: The back-to-back stem-and-leaf display compares the
Q18: Here are 3 boxplots of weekly gas
Unlock this Answer For Free Now!
View this answer and more for free by performing one of the following actions

Scan the QR code to install the App and get 2 free unlocks

Unlock quizzes for free by uploading documents