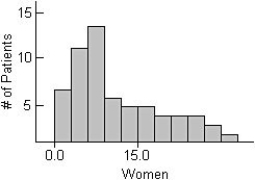
The centre for health in a certain country compiles data on the length of stay by patients in short-term hospitals and publishes its statistical findings annually.Data from a sample of 67 male patients and 63 female patients on length of stay (in days) are displayed in the histograms below. 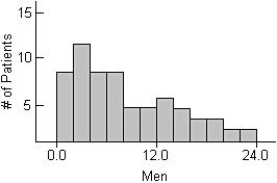
i) What would you suggest be changed about these histograms to make them easier to compare?
ii) Describe these distributions by writing a few sentences comparing the duration of hospitalization for men and women.
iii) Can you suggest a reason for the peak in women's length of stay?
A) i) They should be put on the same scale,from 0 to 40 days.
ii) Men have a mode near 1 day,then tapering off from there.Women have a mode near 6 days with a sharp drop afterward.
iii) A possible reason is childbirth.
B) i) They should be put on the same scale,from 0 to 33 days.
ii) Men have a mode near 3 days,then tapering off from there.Women have a mode near 8 days with a sharp drop afterward.
iii) A possible reason is childbirth.
C) i) They should be put on the same scale,from 0 to 25 days.
ii) Men have a mode near 2 days,then tapering off from there.Women have a mode near 4 days with a sharp drop afterward.
iii) A possible reason is childbirth.
D) i) They should be put on the same scale,from 0 to 15 days.
ii) Men have a mode near 3 days,then tapering off from there.Women have a mode near 10 days with a sharp drop afterward.
iii) A possible reason is childbirth.
E) i) They should be put on the same scale,from 0 to 18 days.
ii) Men have a mode near 7 days,then tapering off from there.Women have a mode near 1 day with a sharp drop afterward.
iii) A possible reason is childbirth.
Correct Answer:
Verified
Q9: Describe what these boxplots tell you about
Q10: The histograms display the body fat percentages
Q11: Which class do you think performed better
Q12: Do men and women run a 5-kilometre
Q13: The histograms show the cost of living,in
Q15: How would you describe the shape of
Q16: Which class had the smallest standard deviation?
A)Class
Q17: The back-to-back stem-and-leaf display compares the
Q18: Here are 3 boxplots of weekly gas
Q19: Which class had the smallest IQR?
A)Class 1,because
Unlock this Answer For Free Now!
View this answer and more for free by performing one of the following actions

Scan the QR code to install the App and get 2 free unlocks

Unlock quizzes for free by uploading documents